 | Time: 3 - 7 hours. The idea in this unit of work is to create a really engaging context for students to explore both experimental and theoretical probabilities in context. Students explore the probability of wining a variety of fairground games and then design and test their own! |
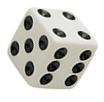
 | Time:1-2 hrs. This activity is based around a set of transitive dice (invented by James Grime) which have a rather surprising set of properties. They are NOT the classic 6-faced dice with numbers one through six on each face - they are far more interesting! Played against each other, rather like paper, rock scissors, there is no dominant dice (red dice beats blue dice, blue beats green yet green beats red). Students find them fascinating to play with (you will not reveal this fact beforehand) and this provides the motivation to analyse the probabilities behind them. You will easily be able to transform a set of normal dice into transitive dice or you may wish to make use of a digital simulation provided. Students are free to solve the problems with whatever probability techniques they have built up, although knowledge of possibility spaces and/or tree diagrams would certainly be helpful. Full solutions for the teacher as well as instructions how best to exploit the dice are provided. |
 | Time: 1 - 2 hrs. This is another practical probability experiment. Students compare the theoretical outcomes of two spinners with that of an experiment (some exposure to sample spaces would be helpful). The teacher can facilitate the sharing of results with a ready prepared spreadsheet. In this activity, students are encouraged to create and program their own digital spinner using Scratch , a simple piece of programming software which can now be used online without any download.Whilst the activity can be completed using a ready made set of spinners, teachers are strongly encouraged to give students access to this software to give them a flavour of programming. A partly made scratch file is provided to help. |
 | This activity sheet offers a concrete example of how fractions, decimals, percentages and ratio are used to measure and define proportions and help us to make "good" decisions. See this blog post  Euro 2016: Fractions, Decimals, % Euro 2016: Fractions, Decimals, % |
 | Time: 1 hour. Minesweeper is an excellent game to encourage students to play. In this activity, students follow up a few games that they could play online with some questions about probability and logical deduction. They are required to think critically about the information they are given and make judgements about the next move by considering the probabilities of revealing mines. |
 | Have some great seasonal fun with this probability game. Students play with their understanding of chance, arithmetic, percentages, spreadsheets and business sense in an attempt to be the most successful Christmas tree seller on the block. Lotteries, strikes, income tax and all kinds of risk come in to play. Lots of fun and plenty of thinking. Time: 1 hour. |
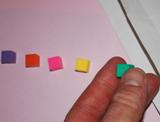
 | Time: 2-3 hours. This activity is about bridging the gap between the intuition of sample space diagrams and the efficiency of tree diagrams. Students will look at a problem from the two points of view, play with multiplying and adding fractions and hopefully see how tree diagrams are a more efficient way of doing the same thing! The activity is good for group work and physical manipulation, although it could be completed on computers by individuals if required. It may well take 2 to 3 hours to complete all of the tasks, but at the end, the hope is that students have a strong understanding of how tree diagrams work that they can apply to different problems. |
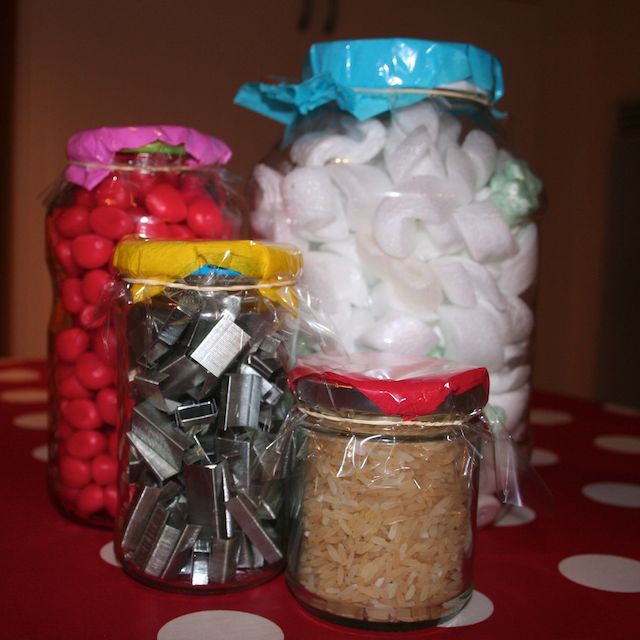
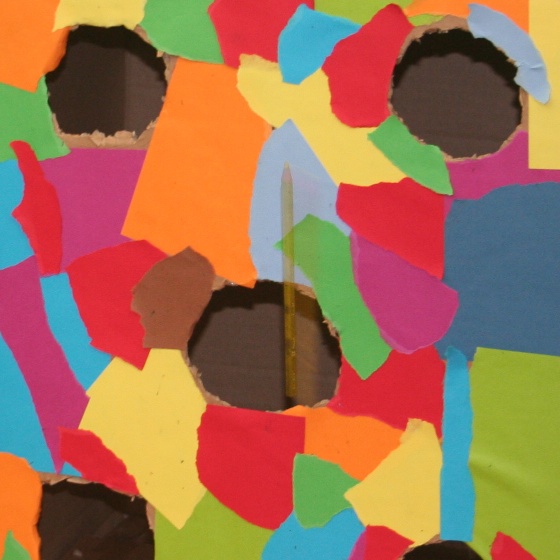
 | Time: 30-40 mins. When we play games of chance we get a more intuitive feel for probability of events happening. This activity is the first of a series of three probability experiments to carry out before students have considered theoretical probability. This one gets students to guess the contents of an envelope by randomly drawing from it. Students love the guessing games! |
 | Time: 1h. Roll, roll, roll… This carefully structured activity aims to get students to discover that experimental probability approaches theoretical probability as we increase the number of trials. We often overlook the importance of carrying out games of chance to build up an intuition for probability. In this case we roll a dice then use a lifelike simulator on Excel to produce up to 2000 rolls. |
 | Time: 1h. This is the third in a series of three practical probability experiments. The aim of this activity is to show that the more times you carry out an experiment, the closer the experimental probability approaches theory. Students will use a free online virtual manipulative to be able to carry out a spinner experiment hundreds of times and make the important discovery. |
 | Time: 45min. There are so many games of chance that catch out our intuition. Consider the next possible moves when two players approach the end of this card game where the goal is to make pairs and not be left with the odd one out (Mistigri, the cat). The aim is to work out the probability of not losing and, since the outcome depends on what the previous player has just done, it practises conditional probability. |